Clean geo layering
Nothing is tied to Google Maps any more. MapLibre draws the whole stack, so overlays composite against the chart in the right order instead of floating on top of tiles that don’t know they’re underneath anything.
Tern · project
Knowledge management for divers. Charts for planning the dive and reviewing the track — with the measuring tools, list of wrecks, and status of lines all in the same place.
Running now, in front of real dives.
Running now. No account needed to open the map.
The old way
The map with the wrecks didn't have any measurement capability, and bathymetry was mediocre. So every dive plan meant lifting a lat/lon out of one tool and pasting it into Google Maps to look for a better beach entry, or Navionics to look at the bathymetry. And nobody knows the status of the line.
Dive Map
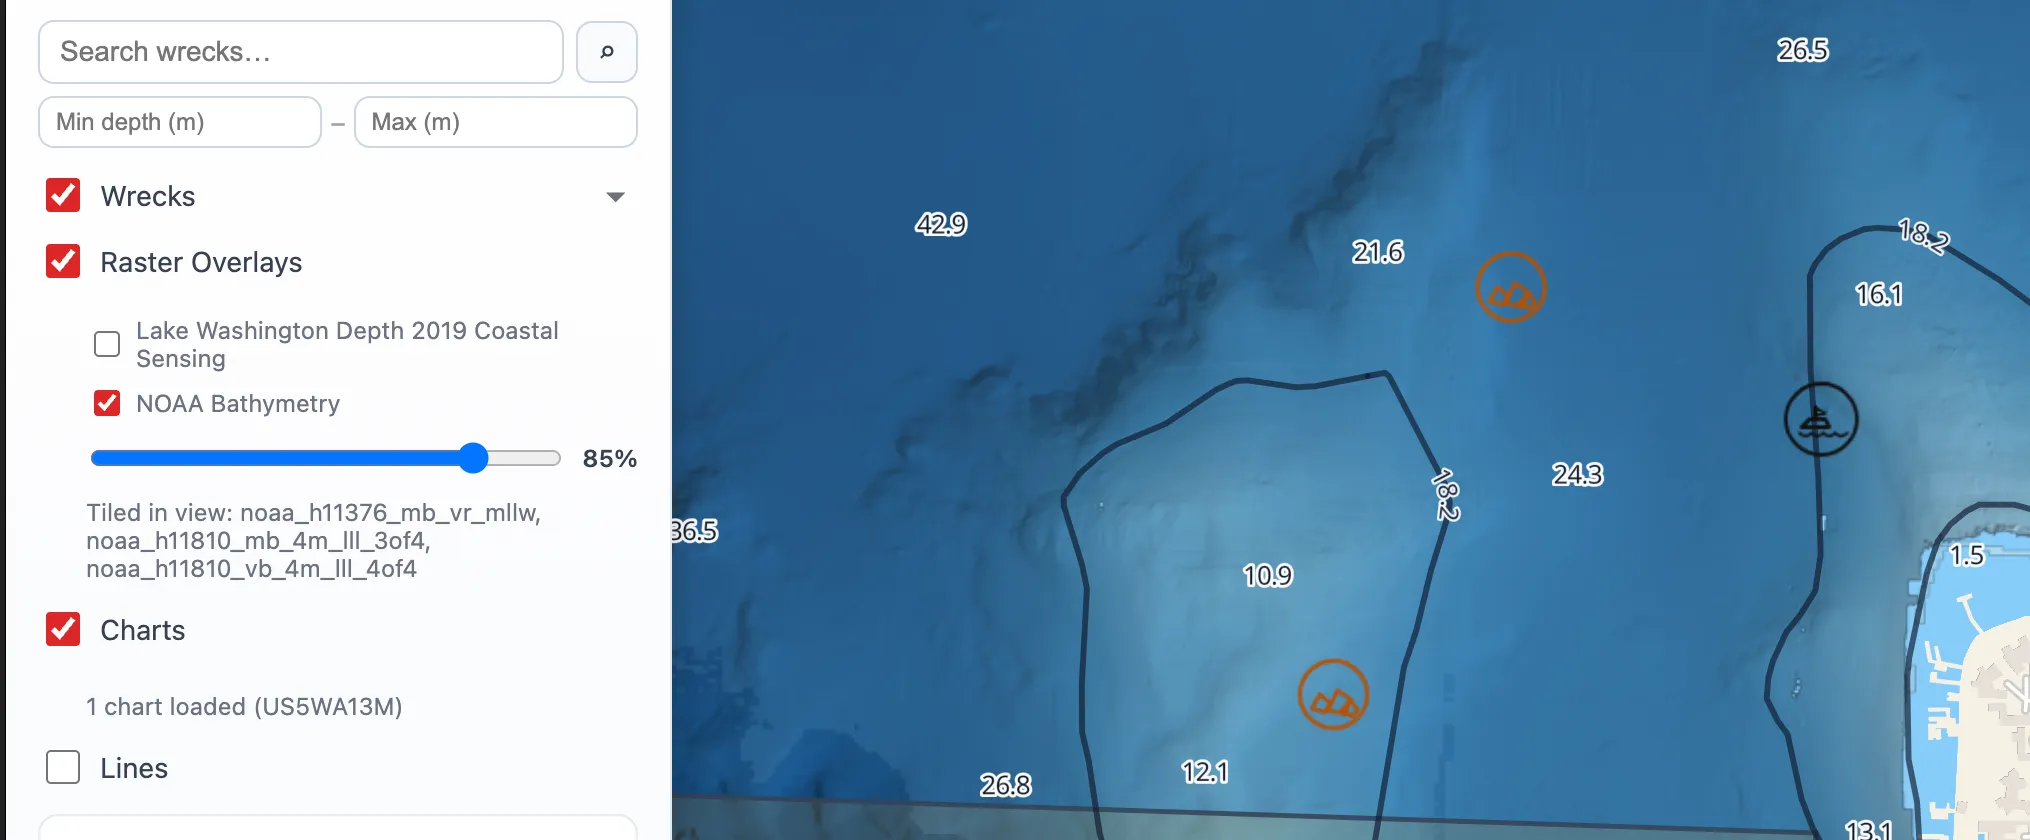
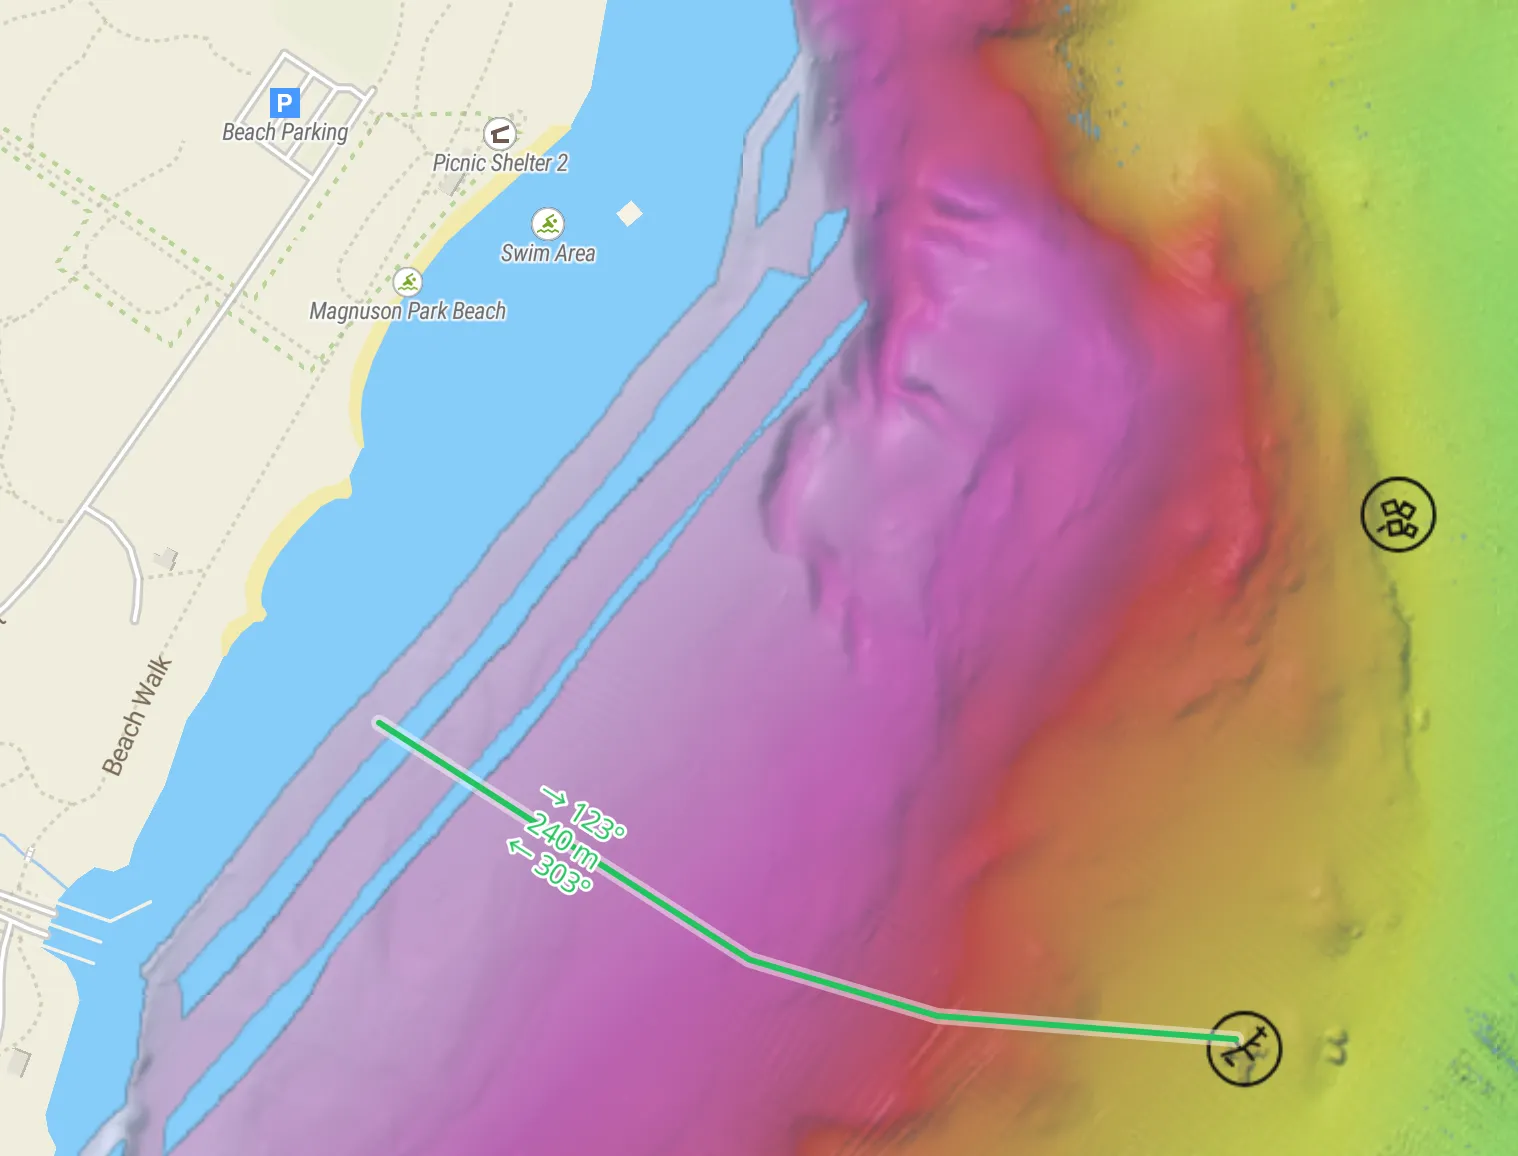
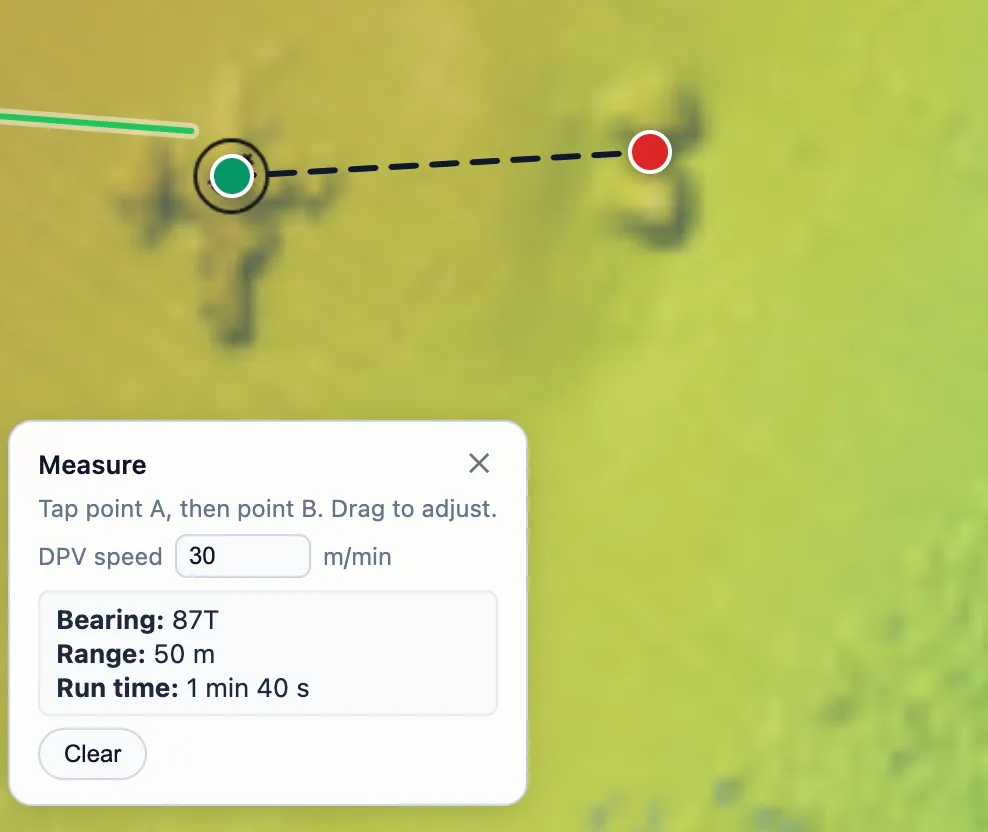
Click two points and read true bearing and range in metres, over the same chart
you’re planning on. Paste a lat, lon to drop a marker, or copy one
back out in the format everything else expects. Inspect the depth and the bathymetry on your planned route. Overlay a street map so you can see what the beach entry will look like.
All in one place.
What’s on the map
Not a pin dropped on a road map. If NOAA publishes it, the goal is that Dive Map can show it as what it actually is — a contour, a sounding, a surveyed depth grid — with each layer on its own toggle.
Nothing is tied to Google Maps any more. MapLibre draws the whole stack, so overlays composite against the chart in the right order instead of floating on top of tiles that don’t know they’re underneath anything.
Electronic Navigational Charts imported feature by feature: bathymetry contours and their depth labels, soundings, charted wrecks, underwater rocks and obstructions, buoys and beacons, seabed type, pipelines and cables, and regulatory areas.
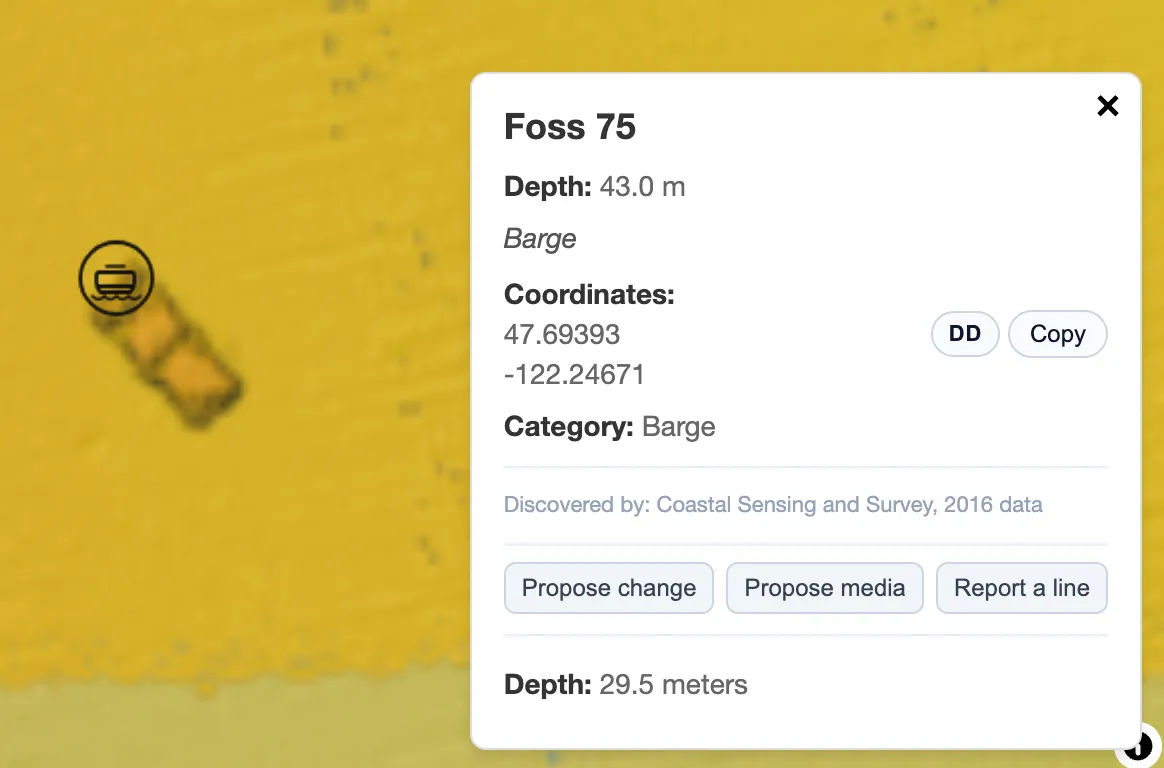
NOAA BAG and A93 surveys ingested as depth-shaded rasters — including variable-resolution BAG, down to 1 m where the survey carries that detail. Real bottom shape, not an interpolated guess between contours. Unless there's demand for it, the cost of running 0.25 m data isn't worth it. Feel free to let me know if you'd like to see that here.
Wrecks & targets
Every wreck carries a category, and the layer panel filters on it. Looking for aircraft means seeing aircraft — not scrolling past every barge and debris field in the lake. Unknown is a real, first-class category rather than a data-entry failure: plenty of what’s down there hasn’t been identified yet, and saying so is more useful than guessing.
Contributing
This is the core capability: together we know more than any one of us, and the map is the knowledge management space. The map gets better by being dived. Anything a diver learns in the water should be a short form away from being on the chart — and the record gives credit to who found what.
Drop a new wreck at a position with a name, depth, category and a circle of uncertainty that says honestly how well you know where it is.
“I explored this — it’s actually a barge, and here are pictures.” Propose a change to any field: category, position, depth, orientation, description. The old value stays visible in review, so a correction is a decision and a tracked change, not a silent overwrite.
Link the video, the photos, the photogrammetry model. The wreck page becomes the place those live instead of a link buried in a forum thread from 2014.
Submissions queue for review before they reach the public map. Approved ones keep their discovery credit, so the map shows who put the site on it.
Credit is part of the data model, not an afterthought. Wrecks carry a discovery credit that shows on the site itself — Coastal Sensing obviously has the high res sidescan work, but many of the rest of us are out finding wrecks routinely. If your exploration is on this map, the map should say so.
Lines
Lines run from known points out to wrecks, and they change: they get rebuilt, they break at a depth, they disappear entirely. That knowledge normally lives in somebody’s head or a group chat. There’s no central place to report that you ran a line, or that you went to run a line and found it was destroyed.
Line geometry is drawn on the chart vertex by vertex and can be edited later, so “the line from the point” is an actual path you can measure against.
Each line carries its construction type and current state — intact, broken, gone — with notes for where the break is and what to look for.
Reports stack newest-first rather than overwriting. A line that was fine in June and broken in August tells you something a single status field can’t.
Accounts
The public map opens without an account. Signing in is what lets you submit wrecks, corrections, media and line reports, and it’s what unlocks the overlays and detail fields that aren’t mine to hand to anonymous traffic. Tiers separate a signed-up visitor from a diver from a tech diver, so access can follow the dive rather than the click. For now, since it’s only been announced to a limited number of divers, every new registrant is automatically promoted to diver -- this can be changed on a moment’s notice.
Creating an account means agreeing to the Terms of Use and Privacy Policy — worth reading before you sign up, since the short version is that what you contribute gets shared with other divers by design.
| Charts | Full NOAA ENC import — bathymetry contours and depth labels, soundings, charted wrecks, rocks and obstructions, buoys and beacons, seabed type, pipelines and cables, regulatory areas. Each is its own toggle. |
|---|---|
| Bathymetry | NOAA BAG and A93 surveys ingested as rasters, including variable-resolution BAG down to 0.25 m where the survey supports it. Rendered as depth-shaded imagery you can sample. |
| Base layers | Street and satellite, switchable. MapLibre renders the whole stack, so overlays composite against the chart instead of floating over someone else’s tiles. |
| Wrecks | Name, position, depth, category, circle of uncertainty, description, discovery credit and linked media. Filterable by category; searchable by name. |
| Lines | Guide-line geometry drawn on the map, with construction type, current condition and a dated report history per line. |
| Measurement | Two-point measure giving true bearing and range in metres. Paste lat, lon to drop a marker; copy any point back out in the same format. |
| Contribution | In-app proposals for new wrecks, corrections to existing ones, and media links — each queued for review before it reaches the public map. |
| Accounts | Optional. The public map works signed out; an account unlocks submissions and the gated overlays. |
Roadmap
Directional, not promised. The further right, the more likely it changes.
Actively being built or tested
Committed, not started
Directional, may change
Open problem. How much position precision to show a signed-out visitor. Some wreck positions are not mine to publish at full resolution, and a coarse public number is only honest if the map says plainly that it is coarse.
Open it
Dive Map is a running app rather than something you build — there’s nothing to flash, print or solder. Open it, pan to water you care about, and turn on the layers you want.
Coverage is deepest where I dive. Empty water is missing data, not absence of wrecks.
Licensing
To be designated — differs from the hardware projects
Dive Map is a hosted service, not a download, so the hardware projects’ build-it-yourself terms don’t map onto it cleanly. Chart data stays under NOAA’s terms; diver-submitted wrecks, media links and line reports stay credited to the divers who submitted them. The server-side licence is still to be designated.
Dive Map is a planning and record-keeping tool built by a diver. It is not an official chart, it is not corrected by Notices to Mariners, and it must not be used for surface navigation. NOAA publishes the authoritative versions of every chart layer shown here — use those to navigate a vessel.
Everything underwater is different than you might expect, even if you have a Really Cool Map. Wrecks may or may not still be there, the bathymetry may be all wrong, someone may have dropped a gill net in your path, who knows. Diver-submitted data is exactly that: submitted by divers, just fallible humans like you and me. We’re all doing our best, but sometimes our best is plain wrong. Verify anything you plan to rely on underwater. Read the full safety position →